Aaron Poole/NHLI
This isn’t particularly important because the team’s systems are likely to evolve under a new coaching staff. But it’s still interesting, with the help of Corsica’s combination charts and Stats.HockeyAnalysis.com’s with-or-without-you charts, to get a sense of who generated the most chemistry – both in attacking hockey, as well as in actual G/60 rates – over the course of the 2016-17 season. Keep in mind that actual “lines” evolve game-to-game, and under Darryl Sutter, the Kings preferred to keep forward groups of “twos” together, not always threes, when they were able to find a rhythm.
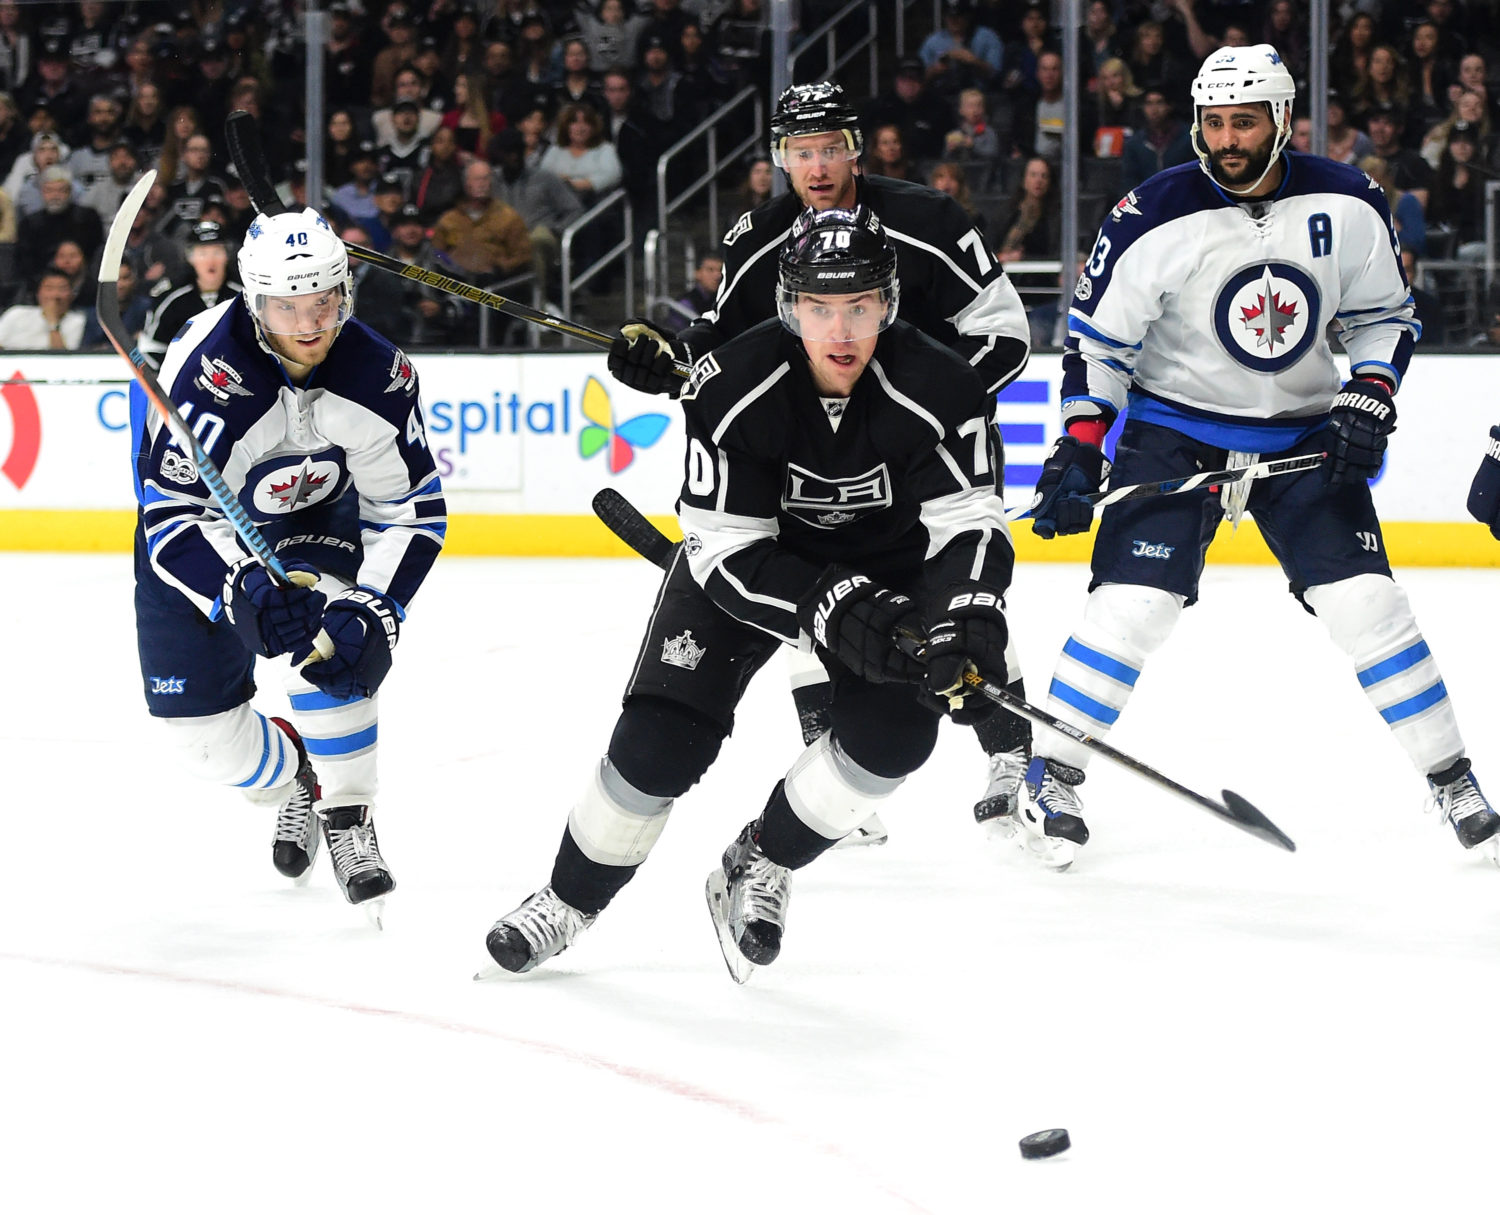
Any conversation needs to feature That 70’s Line at the forefront. A catalyst of the 2014 Stanley Cup run, the trio endeared itself to Kings fans between the spring of 2014 and the first six weeks of the 2014-15 season before settling into inconsistency for the better part of the next 24 months. They were very good when aligned together in 2016-17:

Qualifying lines are ranked by their Corsi-for percentages, which aren’t the be-all, end-all of player and team analysis and will be skewed higher than the mean because Los Angeles led the league in raw Corsi. Shooting percentage? Well, that was a different story.
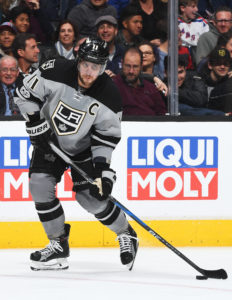
As the chart shows, there was also some chemistry generated by varying alignments involving Anze Kopitar. Generally, Kopitar’s GF60 rate was quite low – his actual raw Corsi also fell for the fourth consecutive year to 54.6% – and while Trevor Lewis isn’t the ideal long-term solution alongside the player who should be, in a regular year, the Kings’ best forward, Los Angeles generated 2.77 goals for (and against!) per 60 minutes when Top Line Trevor was placed alongside the L.A. captain. No other forward who skated with Kopitar for more than 100 minutes of five-on-five play helped the team generate as much as 2.77 GF60. On the other end of the spectrum was the direction of play when Kopitar and Jarome Iginla were on the ice. That direction was often towards the Los Angeles net: The Kings generated a 48.9% Corsi-for and yielded a 3.99 GA60 over the 180 minutes they were on the ice together.
It’s not exactly controversial to say that Jeff Carter was Los Angeles’ best forward this past season. The underlying numbers support what one would expect in a fine Carter season: The Kings averaged 2.60 GF60, allowed 2.20 GA60, and possessed the puck to a satisfactory 54.8% rate. While both Pearson and Toffoli individually pushed play towards the attacking end when on the ice with Carter, an interesting outlier is Brown. Over his 188 5×5 minutes alongside Carter, Los Angeles scored eight times – that’s a 3.51 GF60 – though their raw Corsi was barely above water level and well below the team’s average possession rates.
There were several other interesting outliers. The Kings operated with a 58.9% Corsi-for with Nick Shore and Trevor Lewis were on the ice together. (As one would imagine, though, they didn’t score excessively, and their 2.11 GF60 and GA60 doesn’t deviate too far from the rest of the team’s rates. Nic Dowd skated 307 minutes alongside Kyle Clifford – more than any other forward – and the team scored (and allowed) exactly three goals over that span. Really, it’s more telling of Dowd, who engineered strong possession rates but only a 1.21 GF60, which was a factor in his minus-15 rating. Cool factoids!
Several other factoids learned while taking a look at these numbers: Adrian Kempe had the third highest defensive zone start percentage on the team amongst qualified players yet operated with a 57.2% Corsi-for and a +1.7 CF%Rel. Tyler Toffoli – in what could be read as encouraging numbers heading forward – faced opponents with the combined highest Corsi-for percentage yet pushed the play against them to the tune of a 57.1% CF% and 3.6% CF%Rel. Brayden McNabb led the team with 6.3% CF%Rel, but faced opponents who were not strong puck possessors and started the second lowest percentage of shifts in the defensive zone. And, again, Dowd had a possession rate well in the black, but his offensive zone start percentage was an inflated 44.5%.
Links below are good wormholes to waste some time in, but however much time you spend there, you’ll still return to the same conclusion: The Kings possessed the puck well and stifled the opposition’s offense but did not score much at all. In other breaking news, water remains wet.
Advanced stats via Stats.HockeyAnalysis.com, Corsica Hockey


Rules for Blog Commenting
Repeated violations of the blog rules will result in site bans, commensurate with the nature and number of offenses.
Please flag any comments that violate the site rules for moderation. For immediate problems regarding problematic posts, please email zdooley@lakings.com.