(3) Los Angeles Kings (0-2) vs (2) San Jose Sharks (2-0)
Tuesday, April 20, 2014, 7:00 p.m. PT
Staples Center, Los Angeles, CA
Referees: #20 Tim Peel, #5 Chris Rooney
Linesmen: #76 Michel Cormier, #89 Steve Miller
Prime Ticket, NBCSN, CBC, KEIB 1150 AM
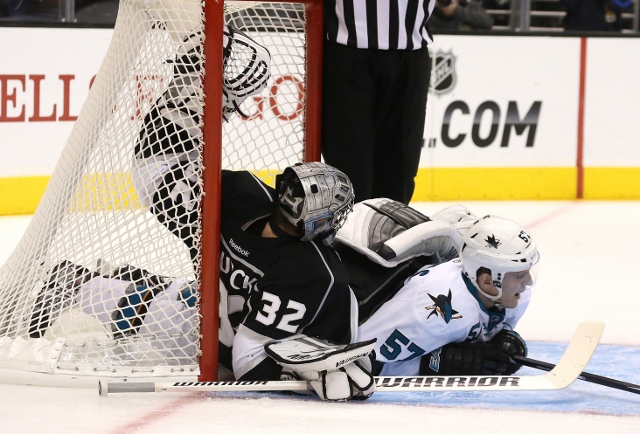
Los Angeles Projected Starting Goaltender – Jonathan Quick
2013-14 Playoffs: 2 GP (2 GS) / 0-2 record / 7.22 GAA / .824 Sv% / 0 SHO
Career, Playoffs: 52 (52) / 29-23 / 2.19 / .924 / 7
Versus San Jose, Playoffs: 15 (15) / 6-9 / 2.80 / .916 / 3
2013-14 Playoffs, Home: 0 (0) / 0-0 / 0.00 / .000 / 0
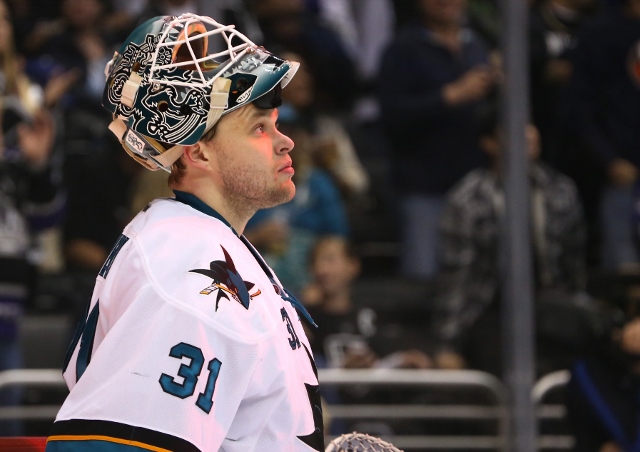
San Jose Projected Starting Goaltender – Antti Niemi
2013-14 Playoffs: 2 GP (2 GS) / 2-0 record / 2.51 GAA / .917 Sv% / 0 SHO
Career, Playoffs: 58 (58) / 34-23 / 2.64 / .910 / 2
Versus Los Angeles, Playoffs: 14 (14) / 8-6 / 2.71 / .900 / 0
2013-14 Playoffs, Away: 0 (0) / 0-0 / 0.00 / .000 / 0
2013-14 Los Angeles Leaders
Total Points: 2 (Four players tied)
Goals: Trevor Lewis (2-0=2), Jake Muzzin (2-0=2)
Assists: Jeff Carter (0-2=2), Anze Kopitar (0-2=2)
Plus/Minus: Jake Muzzin (+2; 2-0=2)
Penalty Minutes: Kyle Clifford (16; 0-0=0)
Time On Ice: Drew Doughty (24:31; 0-1=1)
2013-14 San Jose Leaders
Total Points: Joe Pavelski (1-3=4)
Goals: Patrick Marleau (2-1=3), Joe Thornton (2-0=2), Raffi Torres (2-0=2)
Assists: Joe Pavelski (1-3=4), Matt Nieto (0-3=3), James Sheppard (0-3=3)
Plus/Minus: Justin Braun (+5; 1-0=1)
Penalty Minutes: Mike Brown (14; 1-1=2)
Time On Ice: Dan Boyle (20:49; 0-2=2)
Rankings and Statistics
Goals/Game: LAK – t-10 / 2.50; SJS – 1 / 6.50
Goals Against/Game: LAK – 16 / 6.50; SJS – t-6 / 2.50
Power Play: LAK – t-15 / 0.0%; SJS – 5 / 22.2%
Penalty Kill: LAK – 12 / 77.8%; SJS – t-1 / 100%
Shots/Game: LAK – 11 / 30.0; SJS – 4 / 36.5
Shots Against/Game: LAK – 13 / 36.5; SJS – 6 / 30.0
Faceoffs: LAK – 5 / 52.6%; SJS – 12 / 47.4%
Save Percentage: LAK – 16 / .822; SJS – 6 / .917
Los Angeles Projected Lineup
Marian Gaborik – Anze Kopitar – Justin Williams
Dwight King – Mike Richards – Jeff Carter
Tanner Pearson – Jarret Stoll – Dustin Brown
Kyle Clifford – Trevor Lewis – Jordan Nolan
Jake Muzzin – Drew Doughty
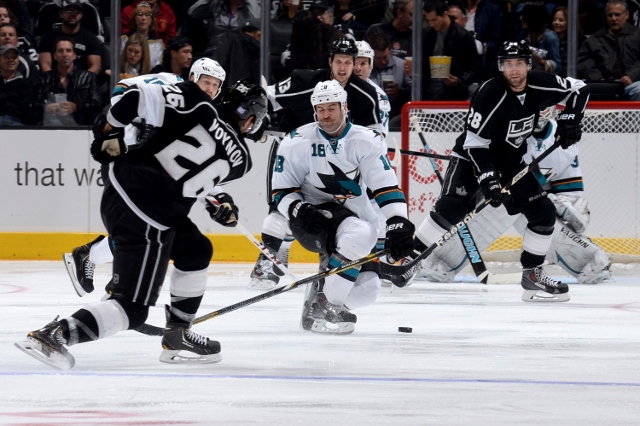
Robyn Regehr – Slava Voynov
Willie Mitchell – Alec Martinez
Jonathan Quick
Martin Jones
Level of confidence in projected lines: D. There would be no tipping of hands for today’s lineup. Only a handful of players made it on the ice at practice yesterday, and there were no line rushes earlier today. I can’t leave the above space blank, so the rationale for this projection is this: Darryl praised Jeff Carter’s effort in Game 2, so I don’t see him shifting from right wing to center. If he’s skating as a right wing, it’s unlikely that it will be to the right of Anze Kopitar, as Sutter has been adverse to stack his lines, and I’d be shocked to see him do so in a series in which they’ve struggled with San Jose’s depth. So I see a second line centered by Richards, with Carter to his right. The left wing would likely be either Dwight King or Tanner Pearson, neither of whom remained on the ice for extra work. With Richards on the second line, that would mean that the fourth line would either be centered by Trevor Lewis or Colin Fraser. I’m leaning towards Lewis, because should Fraser enter the lineup, that would shift Lewis to right wing and move Jordan Nolan over to the left side, the opposite wing that he has played almost exclusively as a King, and I don’t foresee that happening. By placing Lewis and Nolan together, that means that Kyle Clifford is the player amongst the consortium of skaters who remained on the ice slightly later than their teammates (Toffoli, Fraser and Greene were the others) that will draw into the lineup. So by this projection, Toffoli is out. Keep in mind this is a projection based on scant information and the load bearing assumption that the Gaborik-Kopitar-Williams line isn’t split up. It could be wrong. The universe has been built on a series of chaotic events. Anything is possible.
Notes and milestones: Los Angeles is 6-9 all-time against San Jose in the playoffs, a mark that includes a home record of 4-3. The Kings are 94-128 all-time in the playoffs and 54-51 at home. … The Kings are 16-24 all-time in Game 3s. When winning a game 3, they are 11-5 in playoff series. When losing a Game 3, they are 5-19 in playoff series. … Los Angeles is 2-11 all-time in playoff series that they trail 2-0. The two series wins were against Detroit (2001, first round) and St. Louis (2013, first round). In both series wins, the Kings won four consecutive games after falling behind 2-0. … In Games 1 and 2, Los Angeles allowed 13 goals in the first two games of a playoff series for the first time since the second round of the 1990 Stanley Cup Playoffs, when they lost in Edmonton by scores of 7-0 and 6-1 on April 18 and 20. The Kings were swept in that series. The last time Los Angeles allowed 13 goals over consecutive playoff games was when they lost 6-4 and 7-2 to the Canucks on April 21 and 23, 2010. … Including playoffs, home teams are 22-1-1 in the last 24 games between the Kings and Sharks. Los Angeles is 10-0-1 in the last 11 meetings against San Jose at Staples Center. … Jeff Carter has a six-game playoff point streak (1-6=7). … Apart from Trevor Lewis, the 11 forwards to play in Game 1 and Game 2 have not scored on a total of 30 shots. Anze Kopitar Jeff Carter have no goals on six shots, while Mike Richards is the only forward yet to register a shot in either game. … Jonathan Quick is 1-6 with a 3.90 goals-against average and .873 save percentage in his last seven playoff games.
San Jose Projected Lineup
Tomas Hertl – Joe Thornton – Brent Burns
Patrick Marleau – Logan Couture – Matt Nieto
James Sheppard – Joe Pavelski – Tommy Wingels
Raffi Torres – Andrew Desjardins – Mike Brown
Marc-Edouard Vlasic – Jason Demers
Scott Hannan – Dan Boyle
Brad Stuart – Justin Braun
Antti Niemi
Alex Stalock
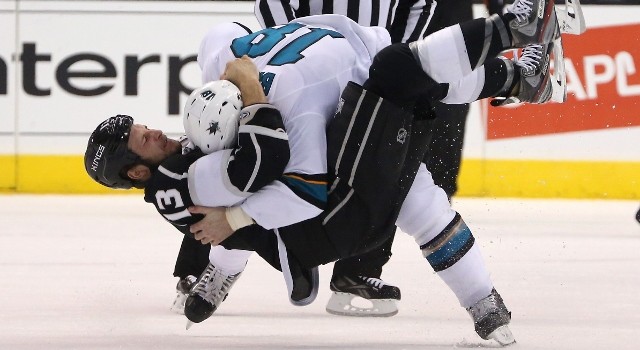
Notes and milestones: Joe Pavelski tied for the league lead with 22 road goals. He had three hat tricks in 2013-14, all of which came in road games. … The Kings and Sharks have combined to average 107 hits per game, 23 hits more than the second highest series average. Pittsburgh and Columbus have combined to average 84 hits per game. … San Jose has targeted Drew Doughty the most, having hit the Los Angeles defensemen 13 times over two games. Dustin Brown is the second most frequent target, having been hit nine times. … Raffi Torres has scored on both shots he has taken in this series. … In Game 2, the Sharks set a franchise record for most consecutive goals in a playoff game (7), most goal-scorers in a playoff game (7), and most goals in a home playoff game (7).
Rules for Blog Commenting
Repeated violations of the blog rules will result in site bans, commensurate with the nature and number of offenses.
Please flag any comments that violate the site rules for moderation. For immediate problems regarding problematic posts, please email zdooley@lakings.com.